The most understated phenomenon on the Internet in recent years is the ubiquitous infographic. Infographics have made it possible to render complex information in an easy-to-understand and visually attractive platform. Thus, infographics have a tendency to go viral and display content in the most appealing manner possible. There are several tools online that can help you build infographics but here are some of the best available online.
Visual.ly
Visually is the largest and coolest data visualization tool available online. In fact, it is touted as the world’s most efficient data visualization tool that also features social capabilities. It offers several ways to create infographics and then market them to audiences who are specifically interested in data that is rendered appealingly. In just a few minutes, incomprehensible data can be turned into a simple and easy infographic that has the potential to go viral.
Knoema
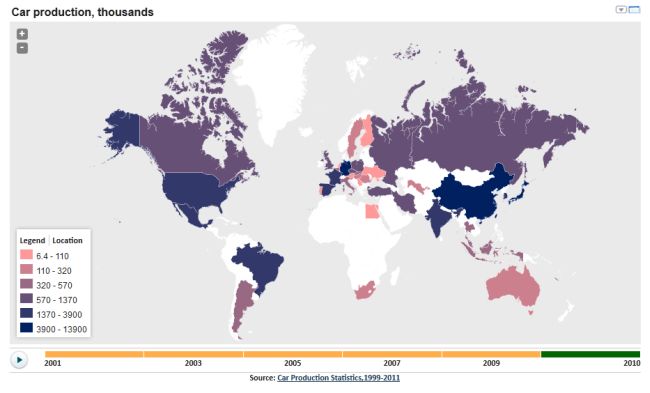
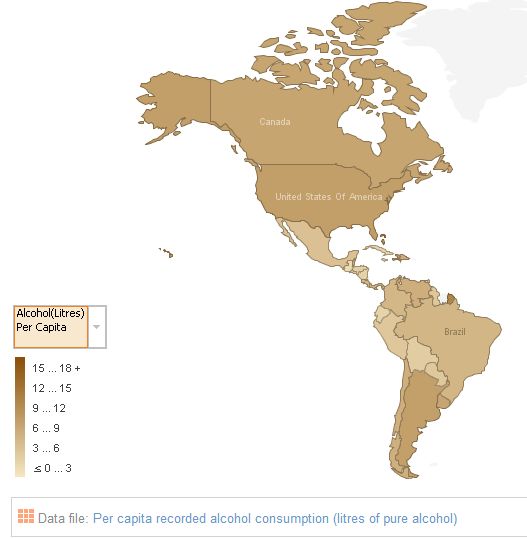
Knoema is almost a personal knowledge highway and has already aggregated several key data clusters with the help of NGOs, research teams and governments. Individuals and businesses can access these infographics or build their own infographic charts that are easy to see and understand. What sets Knoema apart is that it is based on the world atlas and information can be charted geographically. It shouldn’t matter what kind of data you want to convert into an infographic, as long as it has got something to do with maps.
Easelly
Easelly is a great way to create and share visual ideas online and doubles up as an infographic tool. All that you would need to do is choose one of the ‘vhemes’, which are visual themes and then drag and drop your own data to create infographics. It sounds too easy to believe, but that is probably why the tool is named ‘Easelly’.
iCharts

If you were looking for infographics that are more voluminous in nature, iCharts can be a great option. iCharts allow you to create and share data driven stories that have the potential to go viral. Whether helping a local politician or trying to market a complex product to clients, iCharts can be extremely useful and sophisticated.
ManyEyes
If you were looking for graphs and charts that are simpler in nature, you could take a look at ManyEyes. ManyEyes helps you to publish infographics and charts that are less glossy but more substantial when it comes to data. It can be a great way to market and visualize your data for a more serious audience.
Visualize.me

Resumes are very important and they can either get you a job or get you rejected. With that in mind, your resume should not only be attractive but also present your strengths and experiences in an appealing manner. Visualize.me allows you to convert your resume into an attractive graphic infographic that can be shared all across the web. You may even want to print it and send it along with a copy of your traditional text based resume.
Vizify
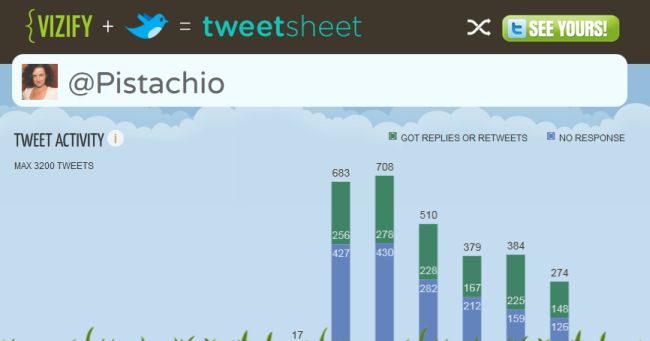
Twitter is certainly the most powerful social network around, and most digital marketers would agree to that belief. If you use Twitter for marketing and business purposes, you would definitely want to know how you or a potential client uses their Twitter accounts. Vizify creates an amazing infographic that presents all the important Twitter data in a visually appealing format. You can check anybody’s Twitter data in an infographic format as long as you know their handle.
Photostats

If you have an iPhone and would like to see your camera history in an infographic, you can download Photostats app. It analyses all your photos on your phone ad visualize your photo-taking habits.
Visualizing.org

Apart from giving you tools to create amazing infographics, Visualizing.org is also a community of creative people. It helps you to make sense of complex issues with the help of data and design.
Piktochart
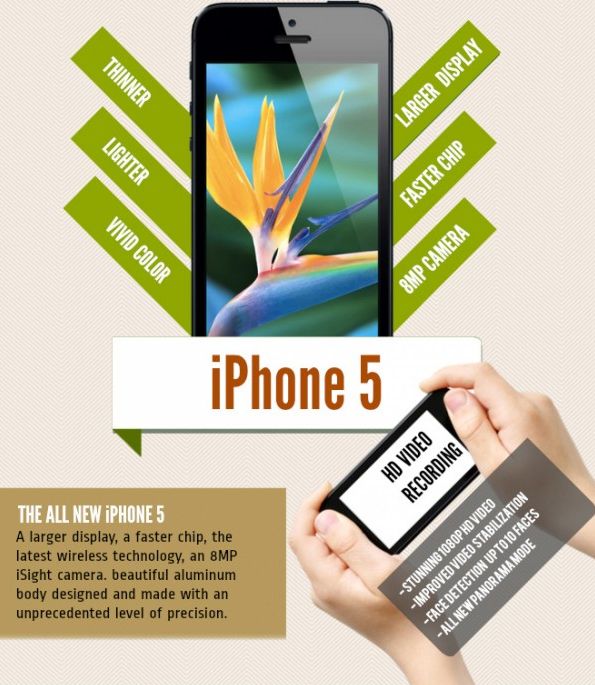
If all that you wanted was an infographic that was loaded with information and data, you might want to try Piktochart. It helps you to build great charts and infographics that are heavy on graphics. It is a great tool for individuals and businesses to showcase their products, services, talents or just provide information.
Infogram
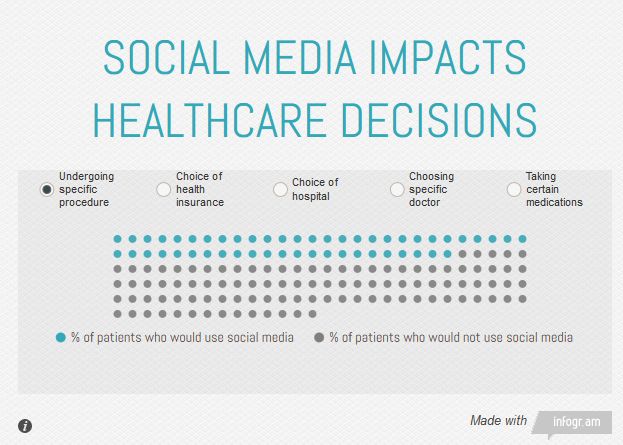
With Infogram, you will no longer have to hire expensive graphic deisgners to build an infographic. You would just need to do your research, gather data and then build visually impressive infographics. It has been featured on several tech blogs and magazines already.
Munterbund
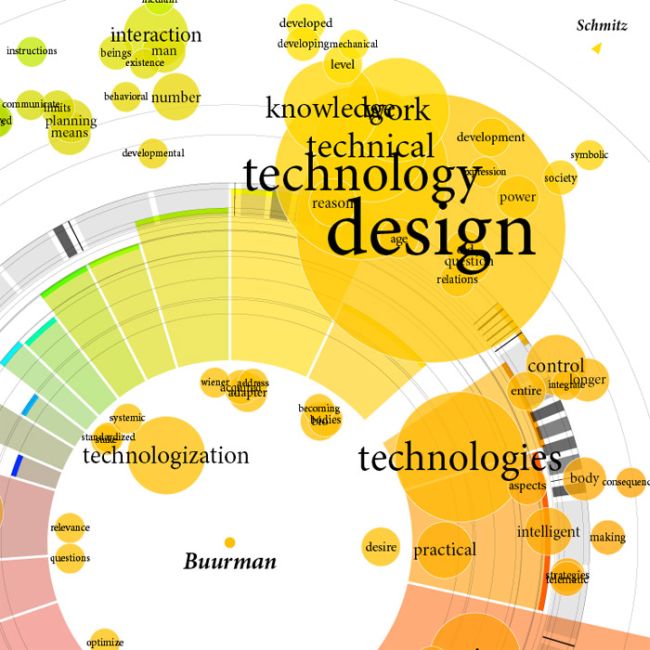
If you are one of those scholarly types, you might want to analyze your essays for semantic and syntactic similarities. Munterbund analyses different essays based on meta-data, keywords and sentence structure.
You can also go ahead and take a look at the 11 Space Infographics that can teach you a lot. Now go ahead and start using these tools listed above to create amazing infographics and wow your audience!


